
AI continues to be a hot topic of conversation in the workplace, at home and in the news. At the forefront of many people’s minds are the gloomy predictions that bots will take over from humanity in ten years’ time because of AI’s lack of governance. While this sounds like science fiction scaremongering, governance surrounding AI and data is a critical priority for this emerging technology.
Housemark’s recent research report, ‘Beyond the AI hype’, examined the adoption of AI. We discovered the use of AI is widespread in the sector despite significant formal governance and strategic gaps. Only a small minority of landlords have a strategy in place to harness the power of AI. Even without a formal strategy, there are many examples of how AI integration into everyday business processes is delivering efficiency gains.
The Beyond the AI Hype report is now available on our website.
Have your say on our next issue: Competence and Conduct
Our next issue will focus on the sector’s readiness for the Competence and Conduct Standard, which comes into effect in October 2026. The standard introduces a professional framework for those working in social housing in England and marks the start of a cultural shift for social landlords where respect, knowledge and accountability must be prioritised.
By taking part in our short survey, you will receive exclusive analysis on the sector’s readiness for the standard, insight into how landlords are tackling it, as well as best practice.
At a glance
This month’s trends
Seasonality
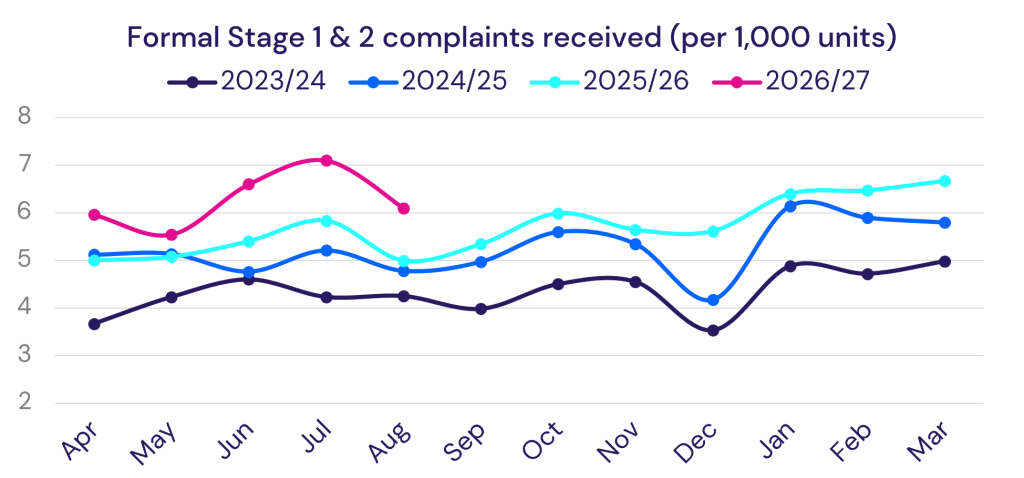
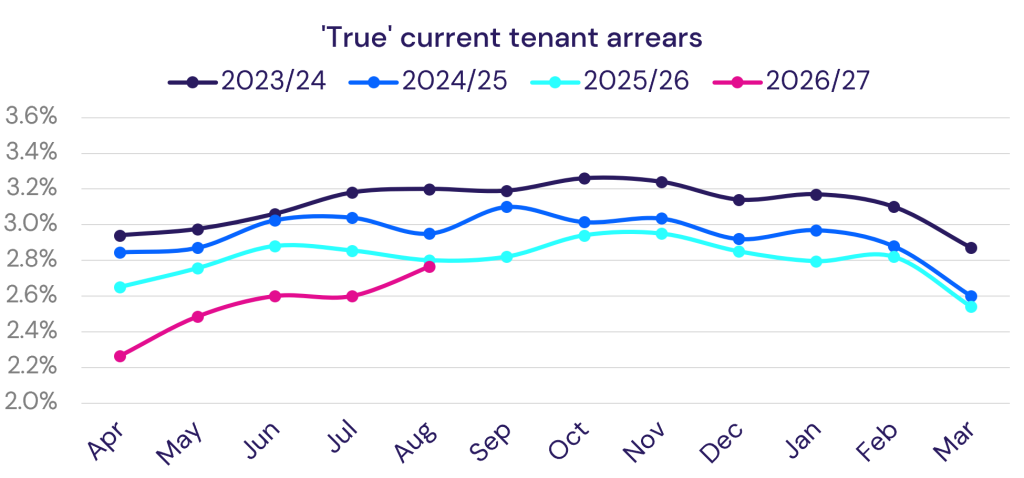
With August being a key holiday month for many people in the UK, we typically record a material effect on the results recorded in Pulse. Similar to the Christmas period, the number of people away from work results in lower outputs during the month. This makes month to month comparisons less useful than year-on-year.
Anti-social behaviour cases per 1,000 homes dropped to a median of 3.61 between July and August 2026, a fall of more than 25%. While this reduction can be explained by summer events such as heatwaves and the football world cup in July, there is also an element of housing management staff availability during the August holiday season to record the ASB case and start to take action.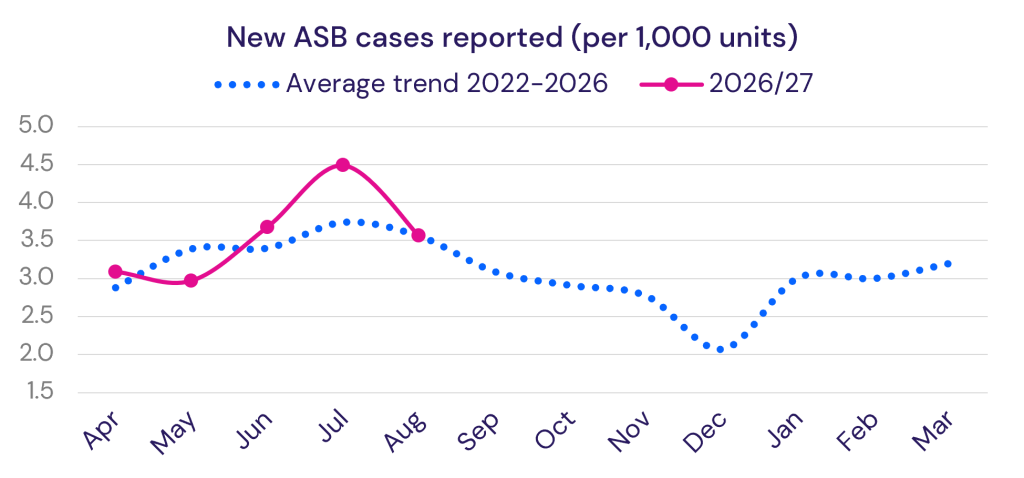
Similarly, the median complaints rate fell considerably between July and August – reducing 14% to 6.10 per 1,000 homes in the most recent dataset. Some of this fall is likely to be due to a reduction in demand for repairs, which is also compounded by fewer staff on duty to record and respond to the complaint once made.
By contrast, the overall trend of complaints increasing is evident in the year-on-year data shows a 23% rise in complaint volumes compared to August 2025, when the median was at 4.96 per 1,000 homes.
Rent arrears collection is another landlord activity that shows seasonality in the results. While the general trend over recent years has been improving performance, the holiday season often coincides with a rise in missing rent payments. At the median, arrears rates rose by 6% from July, ending August at 2.77%. The year-on-year figures again highlight the seasonality in this measure with a much smaller 1.1% difference compared to the result from August 2025.
It is important to consider seasonality when looking at monthly performance results. Knowing that staff and tenants’ holidays are likely to have a material impact on results ought to be considered in any strategic planning process, with additional resources channelled to cover gaps, or an acknowledgement that results will change through the period before correcting in subsequent months. The exclusive year on year data and insight provided by Housemark reveal the trajectory and trends.
If you would like to understand more about seasonal impact on performance results, get in touch.
Voids and lettings
The results from voids and lettings activities measured in Pulse have not recovered from the shock to the system during the pandemic years around 2020 to 2022. While the latest month is showing a month-on-month reduction in median re-let times to 43.2 days, this remains around three weeks longer than sector norms recorded by Housemark in the 2010s.
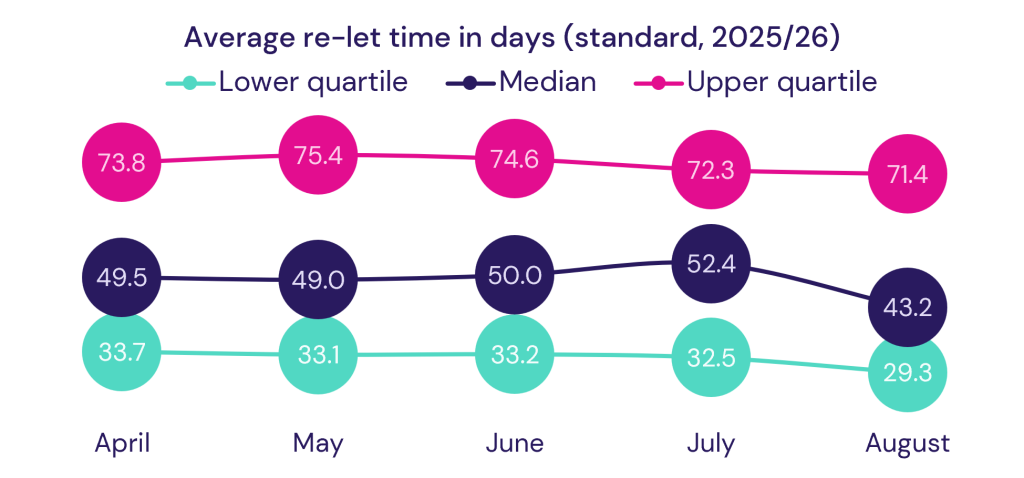
Vacancy rates also remain elevated. In the 2010s, 0.5% was a typical median result reported by landlords. In 2026, the corresponding figure is around 0.6%. While this may seem marginal, across the UK-wide sector we are looking at around 5,000 more homes that are empty at any one time than we recorded 10 years ago.
Housemark’s Voids Forum gives practitioners a platform to discuss good practice and share experiences. With a process as complex as re-letting social housing, it is perhaps no surprise that there is no single reason for this chronic deterioration in performance. Attendees at the latest Voids Forum meeting highlighted many potential drivers of increased re-let times and vacancy rates including:
- Tighter budgets mean fewer people working on repairing voids, resulting in a backlog of properties awaiting work
- Greater numbers of outgoing and incoming tenants with additional needs – which can affect the condition of the property on termination as well as the suitability of new tenants moving in
- Changes in void works specifications – works such as damp and mould root cause investigation and repairs carried out during the void period are pushing back completion times
- Changes in personnel resulting in voids being missed or ‘forgotten’
Strategically, senior managers and governing bodies need to have a strong grasp of the operational reasons for incremental delays in void turnaround that aggregate into weeks onto average re-let times. Target setting needs to consider the latest data, based on the new normal and not look back to results that were achieved in the past or set unrealistic targets.
If you would like to learn more about how your voids and lettings results compare, get in touch.
Customer experience
Overall satisfaction recorded in Pulse fell by 3.6% between July and August 2026 to 75.4%. While this isn’t the lowest median result we’ve recorded this year, it indicates that perceptions are not on a simple upwards trajectory as landlords implement changes to process, service design and strive to improve services.
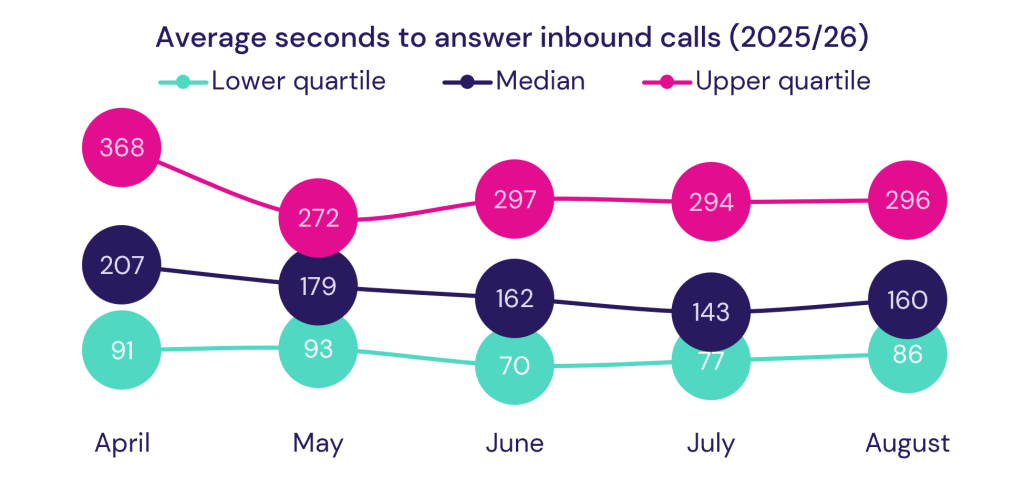
Qualitative data from Housemark members has indicated that key drivers behind sticky satisfaction levels correspond to difficulties with recruitment – especially in contact centres where landlords are competing with a wide range of other businesses and sectors. As a consequence of difficulties covering annual leave over the holiday period, our latest data for August 2026, shows a lengthening of median call wait times to 160 seconds.
Contact centres provide a useful entry point to the sector for new recruits, where they can pick up a wide range of skills and knowledge about the work of social landlords.
Part of the difficulties facing recruiters into the sector was highlighted at the recent Homes and Communities summit. In a session focusing on the CIH campaign Choose Housing, discussion focused on how social housing providers can market the sector as a career path aimed at people who want to make a real difference.
While many young people beginning their career will be aware of the charitable sector, the comparatively higher salaries offered by social housing should make it more appealing. However, the lack of profile social housing has in the mainstream recruitment space can hamper the intake of new people into the sector. We have also received reports that entry level new recruits are progressing beyond those roles, further compounding recruitment and succession pressures.
Housemark’s work with the Housing Futures Network has identified this recruitment gap and will shortly share experiences and examples of good practice for retaining good staff.
If you would like to understand more about your contact centre performance, get in touch.
In Focus: Repairs
Top repairs performers are ‘well managed and well led’
Six years of exclusive data paints a picture of a changing repairs landscape
Repairs remain the most visible service many tenants receive from their landlord. While major investment programmes, compliance activity and building safety work are often less visible to residents, a responsive repair is a direct interaction with the organisation and frequently shapes wider perceptions of service quality.
One of the unique advantages of Monthly Pulse is the ability to look beyond short-term fluctuations and understand what is happening over the longer term. With more than 65 months of repairs data now available, we can build a clear picture of how repairs demand, performance and satisfaction have changed since the immediate aftermath of the pandemic.
The most obvious trend is growing demand. Landlords completed an average of 2.82 responsive repairs per property in 2020/21. By 2024/25 this had risen to 3.56 repairs per property, an increase of 26% over four years, with a further 4.5% increase expected for 2025/26 (based on monthly Pulse data). Over the same period, the proportion of responsive repairs classified as emergencies has remained relatively stable at around 22-23%. This suggests that rising demand is being driven largely by an increase in routine repair activity rather than a deterioration in stock condition resulting in emergency works.
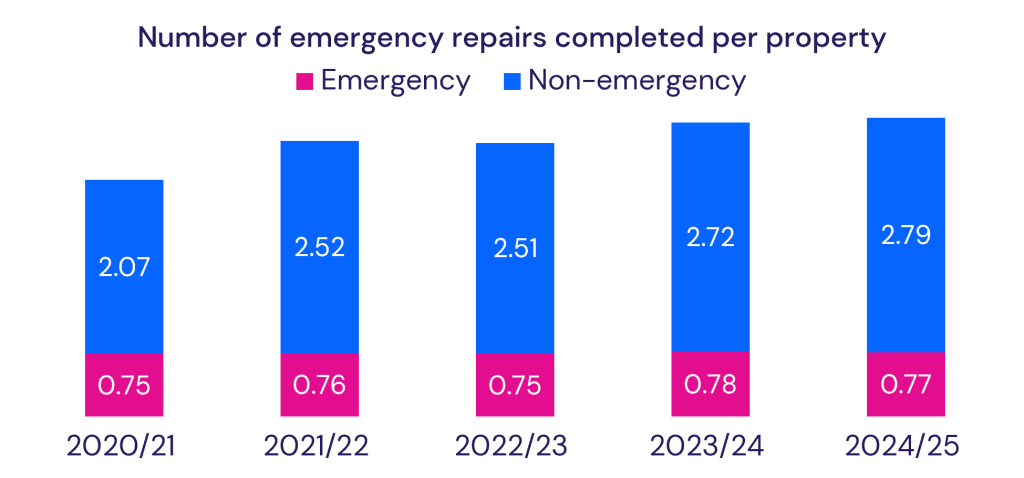
This increase has happened against a backdrop of inflationary pressures, labour shortages, increasing regulatory scrutiny and rising customer expectations. Yet despite these competing pressures, some landlords have continued to improve service performance.
The long-term data also highlights clear seasonal patterns that remain remarkably consistent year after year.
Repairs demand follows a predictable seasonal cycle
Our latest Monthly Pulse data showed responsive repair completions falling by 12.1% in August compared with July, reaching a median of 246.1 completions per 1,000 properties, which is part of a well-established seasonal pattern.
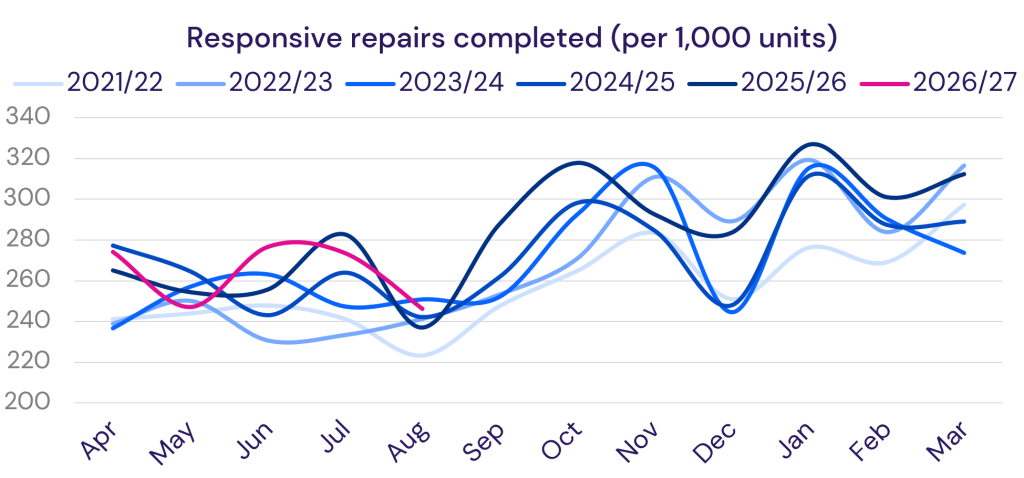
August is consistently one of the quietest months of the year for repairs activity. Workforce holidays, tenant availability and the summer weather combine to reduce both demand and completions. Volumes then increase steadily through autumn before reaching their annual peak during January.
On average, repair completions rise by around 30% between August and January. We also see a significant fall in activity over the festive period, with completions dropping by around 11.5% between November and December before teams work through accumulated demand in the New Year.
Interestingly, the shape of this seasonal pattern appears to be changing. Comparing recent years with earlier Pulse data suggests the traditional winter spike is becoming broader, with noticeable increases in activity now being recorded during October and February. This may reflect changes in how landlords schedule works, improvements in workforce planning or increasing levels of demand throughout the year.
The implication is clear – landlords should not prepare for a single winter peak but for an extended period of elevated activity.
Satisfaction is improving despite increasing workload
Given rising repair volumes, it would be reasonable to expect customer satisfaction to deteriorate. The data suggests the opposite.
Transactional satisfaction with repairs has remained remarkably resilient over the past six years. Scores tend to remain broadly stable around 88% throughout most of the year before dipping slightly during the winter period when volumes rise and backlogs become more common. More importantly, the long-term trend is positive.
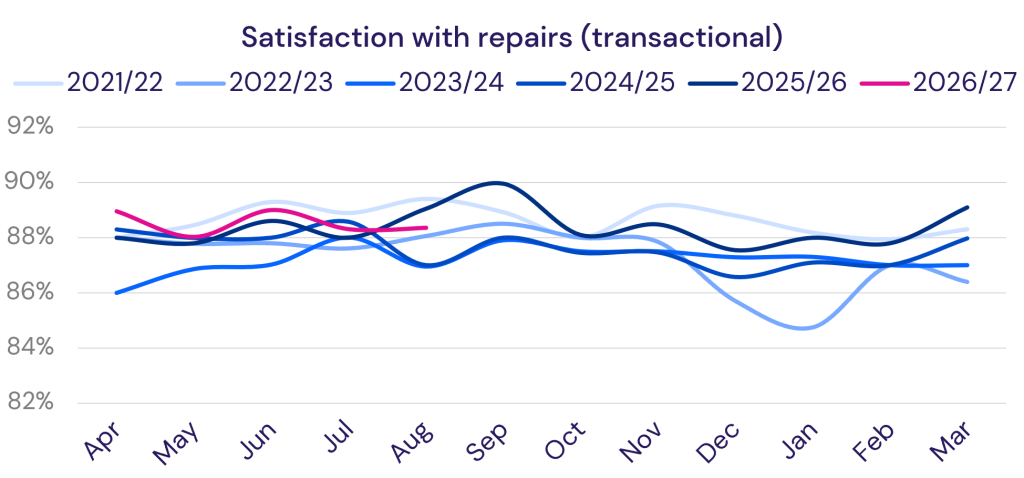
Since 2023, median transactional satisfaction scores have improved across the sector. Local authorities and ALMOs have seen the biggest gains, with median transactional satisfaction increasing by 3.3 percentage points by the start of 2026 compared with the first half of 2023. Housing associations started from a higher baseline but have still recorded modest improvements over the same period.
This tells us two things. First, many landlords are successfully managing increasing demand without negatively affecting customer experience. Second, improvements in repairs services are being recognised by residents. However, transactional surveys tell only part of the story.
Why do repairs feel better than they score?
Across 2025/26, transactional repairs satisfaction was on average 11.5 percentage points higher than perception-based satisfaction. This means residents are often satisfied after an individual repair interaction but remain less positive when asked more generally about the repairs service.
The gap becomes even wider among poorer-performing landlords.
For landlords in the lowest quartile of repairs satisfaction based on perception surveys, transactional scores exceed perception scores by an average of 14.8 percentage points. Among top-performing landlords the difference shrinks dramatically to just 3.0 percentage points.
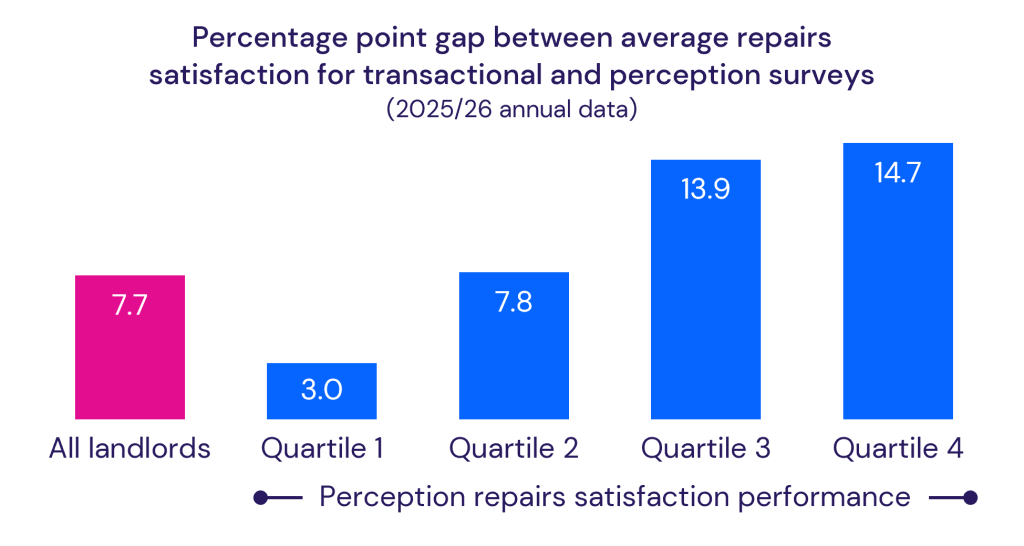
This is important because it highlights the difference between completing repairs successfully and creating confidence in the service.
A landlord may complete an individual repair well, but if communication is inconsistent, appointments are missed or previous repairs have taken too long, customer perceptions can remain negative.
The best-performing organisations appear to be delivering a consistently positive experience rather than isolated examples of good service.
Our findings are echoed by frontline repairs operative and author Joe Carpenter, whose book Middle Ground explores the space between residents, frontline services and housing organisations. Reflecting on what drives resident confidence in repairs services, in a recent interview, Joe argued that landlords can sometimes focus too heavily on completion measures alone.
“There is also an opportunity to look beyond speed as the measure of a good repairs service. Completing a repair quickly is important, but so is doing it properly, communicating clearly and taking ownership when things do not go to plan.”
Joe’s observations mirror what we see in our Pulse data. Landlords with the strongest repairs satisfaction scores are not necessarily those completing repairs in the shortest timeframes. Instead, they are more likely to keep appointments, communicate effectively and create a consistent experience for residents throughout the repairs journey.
Read our full interview with Joe Carpenter and learn more about his book Middle Ground.
What has driven sector improvement?
Significant changes have taken place in the way repairs services are delivered during the last three years.
One of the most notable developments has been the shift towards greater direct control of repairs operations. Housemark data shows the proportion of landlords operating a direct labour organisation increased from 39% in 2022/23 to 44% in 2024/25. Over the same period, the number of maintenance employees directly employed by landlords increased by 136%.
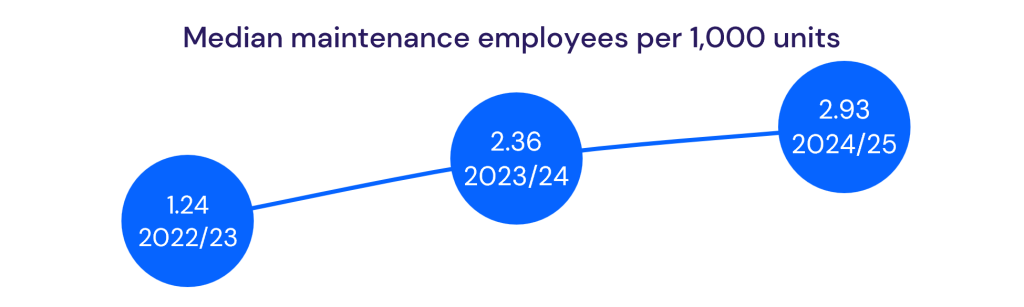 At the same time, spending on planned maintenance has increased materially above inflation.
Taken together, these trends suggest landlords are investing in greater operational control, improved asset intelligence and a more proactive approach to stock management.
This does not necessarily mean bringing repairs in-house is the right solution for every landlord. The data cannot tell us that. What it does suggest is that organisations are increasingly recognising the strategic importance of repairs and investing accordingly.
The strongest performers focus on reliability
The data challenges some commonly held assumptions about repairs performance. Many landlords focus heavily on average days taken to complete repairs. However, our analysis suggests this is not the strongest indicator of customer satisfaction.
The organisations with the highest repairs satisfaction scores are more likely to excel in areas such as appointments kept and repairs completed within target.
Housemark analysis shows that 60% of landlords in the top quartile for repairs satisfaction are also in the top quartile for appointments kept. By comparison, only 32% are in the top quartile for average repair completion times.
Top-performing landlords also keep significantly more appointments than their peers and record stronger scores for keeping residents informed. Housemark data shows 70% of landlords in the top quartile for repairs satisfaction are also in the top quartile for satisfaction that the landlord keeps tenants informed.
This suggests that reliability matters more than speed.
Residents appear more willing to accept longer repair times if expectations are managed, appointments are honoured and communication remains consistent throughout the process.
What can landlords learn from recent improvement programmes?
Case study: Settle – improving the repairs journey from first contact to completion
Like many landlords, Settle recognised that repairs performance is about more than simply completing jobs faster. Through its Repairs Service Improvement Plan, the housing association focused on improving the whole customer journey, shaped by what residents said mattered most: quicker repairs, right-first-time outcomes and better communication throughout the process.
The programme included improvements to scheduling, repairs tracking and communication, alongside changes designed to increase first-time fixes. Operatives were better equipped with the materials needed to complete jobs during the initial visit, while residents were given greater control through the My Settle portal, allowing them to book and manage appointments online. Clearer service standards were also introduced so customers understood what to expect.
The results suggest that these operational changes are starting to pay off. Between April 2025 and March 2026, average waiting times reduced from 32 days to around 21 days, while the number of repairs in progress fell by more than half. Routine repairs performance improved, with more than 80% completed within 28 days and targets exceeded for three consecutive months. Emergency repairs remained a particular strength, with 99.9% completed on time. The landlord also reported a 96% reduction in damp and mould cases since April 2024.
The example highlights how better scheduling, stronger work management and clearer communication can help landlords reduce backlogs while improving the customer experience.
Case study: Newlon Housing Trust – tackling a repairs backlog through stronger oversight
When the introduction of new repairs contractors led to higher-than-expected volumes and growing delays, Newlon Housing Trust responded with a targeted Service Improvement Plan focused on restoring performance and resident confidence. Rather than relying on a single intervention, the landlord combined additional capacity with tighter management and greater accountability.
Newlon strengthened the way the repairs service was managed internally, worked closely with contractors to improve performance, introduced specific targets to reduce outstanding jobs and brought in additional contractors to accelerate progress. Importantly, it also focused on customer communication, proactively contacting residents with overdue repairs and providing updates on progress. Oversight was further strengthened through daily reporting and ongoing monitoring by both the Board and Residents’ Forum.
By August 2026, the programme had delivered significant improvements. The number of overdue repairs had reduced by almost 75%, while the overall repairs backlog also fell substantially. Most notably, resident satisfaction with the repairs service increased from 69% to 85%, demonstrating the impact that improved service delivery and communication can have on customer perceptions.
The case study reinforces a message seen repeatedly across the sector: reducing work in progress is important, but residents are more likely to notice and value improvements when operational performance is matched by regular communication and visible accountability.
From reactive to predictive repairs
The next phase of repairs improvement may involve identifying issues before they become problems.
Housemark is currently developing a repairs intelligence data science platform pilot focused on predictive and AI-driven use cases within repairs. The pilot will explore opportunities to identify emerging repair risks, spot repeat failure patterns, predict cost escalation and optimise interventions before failures occur.
The ambition is not simply to improve repairs performance but to help landlords move from a reactive operating model towards a predictive one.
For a sector facing increasing demand, ageing stock and continued financial pressure, the ability to anticipate repairs rather than respond to them could be one of the most significant opportunities of the next decade.
The evidence from six years of our Pulse data is clear. The landlords delivering the best repairs outcomes are not necessarily those completing repairs the quickest. They are the organisations that combine strong leadership, robust operational management, clear communication and a relentless focus on delivering a consistent customer experience.
To find out more about how we can help with your repairs service or to look at a service review or deep dive with a member of our team contact us.
Latest news and insights


Month in numbers: August 2026
The results in the table below have been calculated based on submissions from 137 social landlords.
Open an Excel version of this table
| Measure | Lower Quartile | Median | Upper Quartile | Change (Jul – Aug) |
| Repairs and maintenance | ||||
| Percentage of homes with a valid gas safety certificate | 99.67% | 99.94% | 100.00% | No change |
| Percentage of homes for which all required electrical safety checks have been carried out | 98.01% | 99.55% | 99.92% | No change |
| Responsive repairs completed (per 1,000 units)* | 210.0 | 246.1 | 280.1 | – 12.1% |
| Percentage of non-emergency responsive repairs completed within target | 77.6% | 87.0% | 92.4% | + 0.7% |
| Responsive repairs outstanding (‘work in progress’) | 8.6% | 6.0% | 3.7% | + 4.0% |
| Satisfaction with repairs (transactional) | 83.9% | 88.4% | 92.0% | + 0.6% |
| Housing management | ||||
| ‘True’ current tenant arrears | 3.75% | 2.77% | 2.09% | + 6.6% |
| Percentage of dwellings vacant but available to let | 1.05% | 0.61% | 0.30% | + 1.7% |
| Average re-let time in days (standard re-lets) | 71.4 | 43.2 | 29.3 | – 9.4% |
| New ASB cases reported (per 1,000 units)* | 2.13 | 3.57 | 5.83 | – 25.4% |
| Customer experience | ||||
| Formal Stage 1 & 2 complaints received (per 1,000 units)* | 3.86 | 6.10 | 8.10 | – 14.1% |
| Percentage of Stage 1 & 2 complaints resolved within timescale | 85.7% | 97.5% | 100.0% | + 0.3% |
| Percentage of customer contact received via digital channels* | 30.3% | 37.4% | 49.8% | + 1.5% |
| Average time taken to answer inbound telephone calls (in seconds) | 296.0 | 160.0 | 86.0 | + 1.9% |
| Satisfaction with the service their landlord provides (perception) | 70.4% | 75.4% | 81.5% | – 3.6% |
| Staffing | ||||
| Percentage of working days lost to sickness absence | 4.6% | 3.7% | 3.0% | – 1.5% |
| Percentage of voluntary staff turnover | 1.6% | 0.9% | 0.5% | + 8.7% |
| Awaab’s Law | ||||
| New emergency hazards reported per 1,000 properties* | 24.9 | 46.4 | 76.4 | – 13.3% |
| New significant damp and mould hazards reported per 1,000 properties* | 0.4 | 1.8 | 4.6 | – 19.7% |
| Percentage of emergency hazards resolved within 24 hours | 94.0% | 98.3% | 99.9% | + 0.1% |
| Percentage of significant damp and mould hazards investigated within 10 working days | 84.0% | 98.0% | 100.0% | – 0.4% |
| Percentage of significant damp and mould repairs initiated within 5 working days | 78.6% | 100.0% | 100.0% | No change |
The quartiles presented in this table are presented with polarity, which means that Upper Quartile always represents the most favourable quartile. Some KPIs don’t have a polarity (indicated with a * next to the measure name) – meaning that neither high or low values are better. In these instances, Upper Quartile represents the largest values and Lower Quartile, the lowest.