
With much of the UK experiencing the ‘hottest summer on record’, we predicted a key set of seasonal effects in Pulse data – relating to repairs, lettings, Awaab’s Law, and ASB.
This month’s Pulse looks at each of these activities, with a special focus on ASB, and assesses where the figures are driven by external factors such as weather, and where they are affected more by landlords’ systems for recording, processing and approaches to delivering work.
While the summer weather is due to end soon, our Pulse data will continue to provide up-to-date data and exclusive insight on where the social housing sector is heading and what landlords need to do to get ahead.
In this issue:
- Our ASB special focus reveals exclusive insight into the nuances of ASB recording and the need for a holistic response from landlords
- Extended summer season and climate prognosis requires a different approach to seasonality staffing and services
- Average re-let times go above 50 days for the first time since March
- We establish a clear link between repairs work in progress and satisfaction
- Awaab’s Law Phase 2 focus on tenants requires organisation-wide approach.
At a glance
This month’s trends
Works in progress
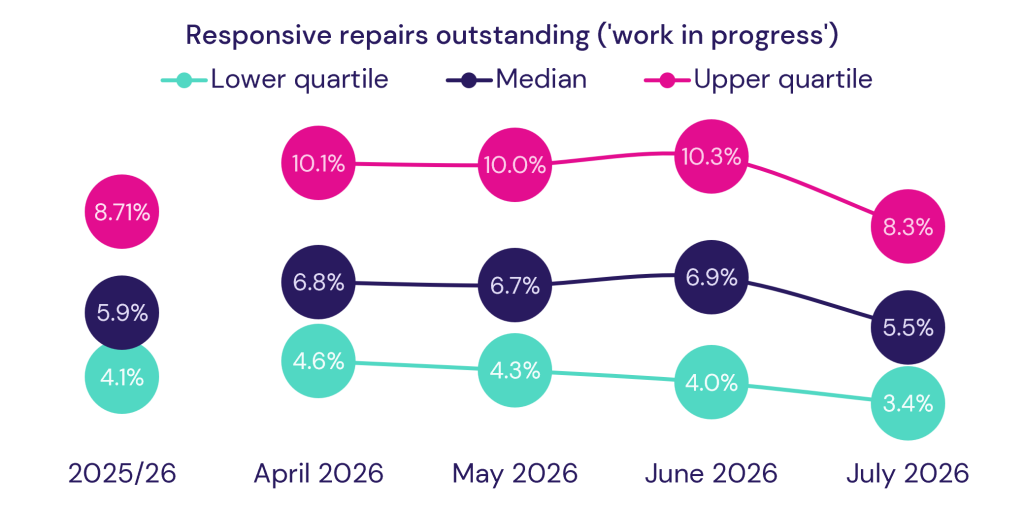
The proportion of repairs ordered but not completed – work in progress (WIP) – continues to move in the right direction. This provides some encouragement after the sustained pressures experienced across repairs services in recent years. The median proportion of responsive repairs outstanding at month-end fell to 5.5% in July, a month-on-month reduction of 3.3%. The interquartile range remains relatively narrow, suggesting that most landlords are reporting similar levels of backlog.
This improvement comes despite repairs demand increasing slightly over the month. Landlords completed a median of 283 responsive repairs per 1,000 homes in July, up 1.4% from June. Small increases in repair activity between June and July are typical as summer provides more favourable conditions for batched work and access arrangements, making the reduction in WIP particularly positive.
However, beneath the headline improvement, signs remain that challenges have not disappeared entirely. While the median landlord is reporting a WIP position comfortably below 6%, around one in five landlords recorded WIP levels above 10% in July. This highlights a significant gap between those that have brought outstanding work under control and those still managing larger backlogs. The same data shows more than one in ten landlords recording average WIP levels above 10% across the last four months. For some organisations, higher levels of outstanding work are becoming a persistent operational issue rather than a short-term fluctuation.
We have evidence that sustained backlogs may be influencing the resident experience. Landlords with average WIP levels above 10% over the previous four months reported transactional repairs satisfaction 1.6 percentage points below the median, demonstrating the impact that repairs have on how residents feel. While this is not a dramatic gap, it reinforces the relationship between outstanding work and tenant perception. Repairs satisfaction remains relatively strong overall, with a median score of 89.0%, but unresolved repairs appear to be having a measurable effect where backlogs persist. This exclusive insight makes the clear case for tackling repairs backlogs.
Taken together, July’s results highlight that many landlords are making progress in reducing outstanding repairs while meeting new demand. The key question over the coming months will be whether organisations with consistently higher levels of WIP can close the gap to their peers, or whether capacity constraints, contractor availability and competing compliance priorities begin to slow progress once again. Through monthly Pulse we will continue to exclusively reveal this insight and the steps that can be taken to improve performance.
Lettings
Our latest Pulse data presents an interesting picture for landlords. On the one hand, the number of homes standing empty and available to let continues to reduce. On the other, the time taken to re-let properties has moved above 50 days for the first time since March.
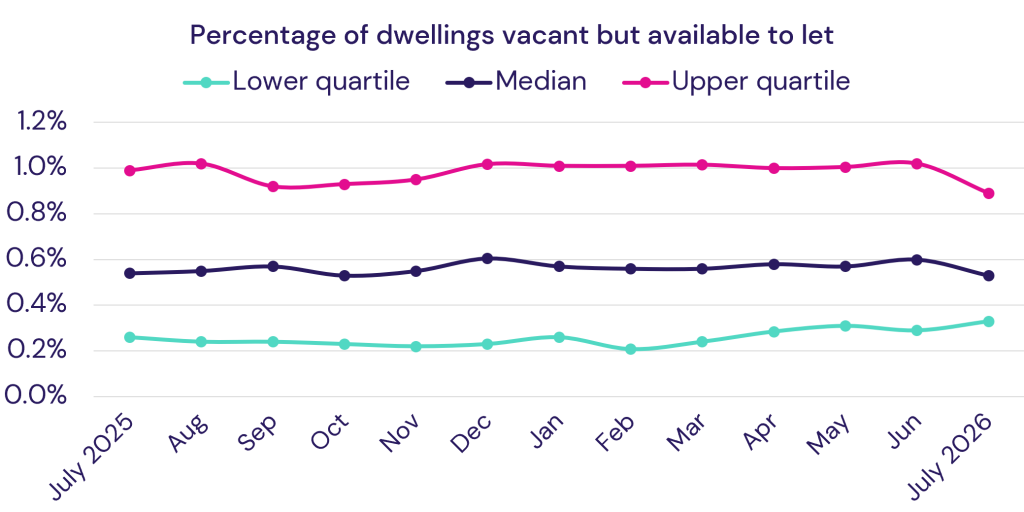
The median vacancy rate fell by 8.5% month-on-month to 0.53%, with levels now 9.2% lower than in July 2025. This continues a gradual improvement seen over much of the year. The strongest progress has been at the lower end of the distribution, where some landlords have consistently reduced the proportion of homes sitting vacant. However, it remains too early to confirm whether this marks a sustained improvement or simply monthly variation.
Against this backdrop, the median re-let time rose to 50.5 days, up 6.3% from June. Meanwhile, the spread of results remains wide, with upper-quartile landlords reporting average re-let times of more than 69 days compared with fewer than 32 days among the best-performing quartile.
At first glance, falling vacancies and rising re-let times appear contradictory. However, typically they point to a shift in the types of properties being re-let. Many landlords have spent recent years reducing larger backlogs of long-term empty homes, often prioritising properties requiring more extensive works before they can be allocated. As those homes move through the system, average re-let times can increase even while vacancy levels fall.
There are also likely to be seasonal influences at play. Summer often brings competing pressures on repairs teams and contractors, while applicant availability, holidays and tenancy sign-up arrangements can all affect the speed at which homes are occupied. More complex pre-letting requirements, higher property standards and continued focus on property condition may also be extending turnaround times in some organisations.
The key question which we will continue to explore, will be whether July represents the start of a wider trend. Demand for social housing remains extremely high, and vacancy rates suggest landlords are generally keeping empty homes to a minimum. However, if re-let times continue to drift upwards over the coming months, it may indicate growing pressure within voids and lettings processes. Currently, the sector can evidence that its succeeding in reducing the number of homes standing empty but doing so is taking longer than it was earlier in the year.
Awaab’s Law
Over the nine months of exclusive data we’ve collected, analysed and reported since Phase 1 of Awaab’s Law went live, we have found many landlords struggling to develop systems to manage new administrative requirements at comparatively short notice. Over the initial period up to March 2026, we reported a wide range of results as landlords’ understanding of the new regulations varied considerably.
This has now changed. After an initial period, we introduced stricter validation rules in the spring and removed unverified out of range data until the landlord confirmed the numbers or provided different figures. This approach has helped many landlords understand the detailed requirements of Awaab’s Law Phase 1, and means we have reached a stable, steady set of figures for the five KPIs we cover in Pulse.
The measure landlords found the hardest to record was the rate of emergency hazards recorded per 1,000 homes. The scope of this extended to all hazards, even in Phase 1, which wasn’t widely understood when Awaab’s Law came into effect.
The chart below shows validated results for a consistent cohort of landlords. Since April, the inter-quartile range for emergency hazards has consistently been between 30 and 90, which corresponds with TSM data for emergency repairs, which average between 20 and 100 per 1,000 homes.
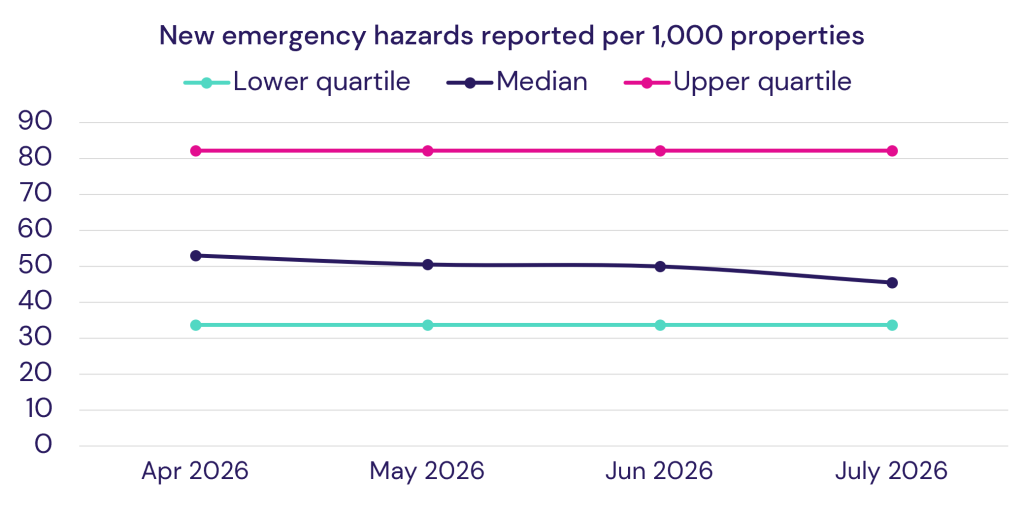
Similarly, other Awaab’s Law measures in Pulse have undergone a period of regularisation since April this year, with only small movements in quartiles for the number of significant damp and mould cases as well as the proportion of cases meeting regulatory target timescales. For landlords submitting Awaab’s Law Pulse data, we have evidence that Phase 1 work is in-hand.
With Awaab’s Law Phase 2 confirmed go-live on 30 November 2026, English social landlords are planning and understanding how systems need to expand to take account of hazards that extend beyond building safety into using the home. The increased scope of Awaab’s Law Phase 2 means that activities such as pest control and occupational health could be subject to the same action and reporting timescales as reports of damp and mould.
Put simply, Awaab’s Law Phase 2 extends landlords’ duties across maintenance and management operations. Without systems in place to draw in expertise in these new areas, landlords risk missing Awaab’s Law deadlines and can expect cases to escalate through to the Ombudsman and potentially into court.
We are helping landlords understand how to deliver services that fall under Awaab’s Law and record data appropriately. If you are looking at moving your service into Phase 2 contact us consultancy@housemark.co.uk.
In Focus
Anti-social behaviour
Setting the scene
Anti-social behaviour is rarely driven by a single factor. It is shaped by place, people, opportunity, reporting practices, and the capacity of local services to respond. Summer brings many of these factors together. Longer days, school holidays, open windows, outdoor socialising, staff leave and a calendar full of community and sporting events all result in more contact between neighbours. Most of that contact is positive, but it also creates more opportunities for noise, nuisance, conflict, and existing tensions to surface.
This year provides a particularly clear example. By 15 July, the UK had experienced three widespread heatwaves, recorded more days above 30°C than the whole of 1976 and become the first year on record to reach 35°C in May, June, and July. Mean temperatures were 1.8°C above the long-term summer average across the UK, rising to 2.4°C above average in England and 2.2°C in Wales. Scotland and Northern Ireland were also warmer than average, although to a lesser extent. Persistently warm nights were another defining feature, extending the hours during which people were outside or keeping windows open.
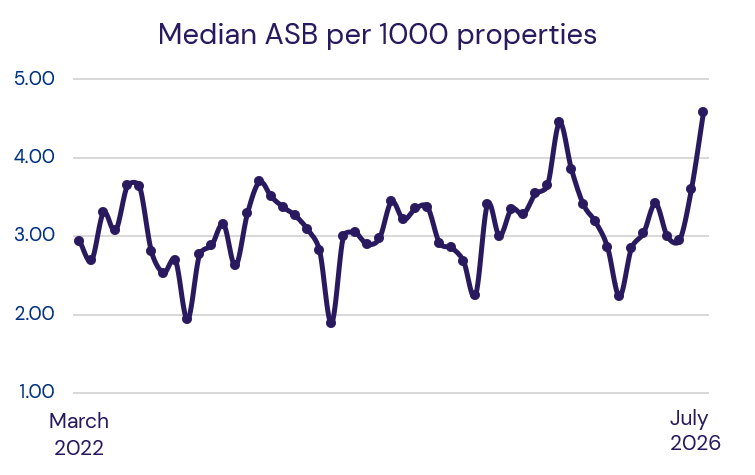
Our data shows what this has meant for landlords. The median number of new ASB cases reached 4.58 per 1,000 homes in July 2026, an increase of 24.3% in a single month. The lower and upper quartile positions were 2.42 and 8.40 respectively, demonstrating the continuing variation between organisations. July increases are expected, but this year’s uplift was larger than recent years. It also followed a 32% rise between May and June, demonstrating that summer demand arrived earlier and has continued to build.
What does ASB mean in 2026?
Before asking why ASB rises during the summer, it is worth asking what we mean by anti-social behaviour. The answer is not always straightforward.
ASB covers a wide range of behaviour, from persistent noise and nuisance, to intimidation, harassment, hate incidents, as well as activity connected to serious criminality. The Anti-social Behaviour, Crime and Policing Act 2014 provides the legal framework, but applying that framework to everyday situations requires judgement. Context, persistence, timing, frequency, vulnerability, and impact all matter.
On the one hand, children playing, footsteps, household appliances and one-off parties are not automatically ASB. By contrast, persistent intimidation, targeted harassment, repeated excessive noise or behaviour causing serious distress require a very different response. The challenge for landlords is to distinguish between reasonable household activity, neighbour disputes, and behaviour that has become persistent, harmful or threatening.
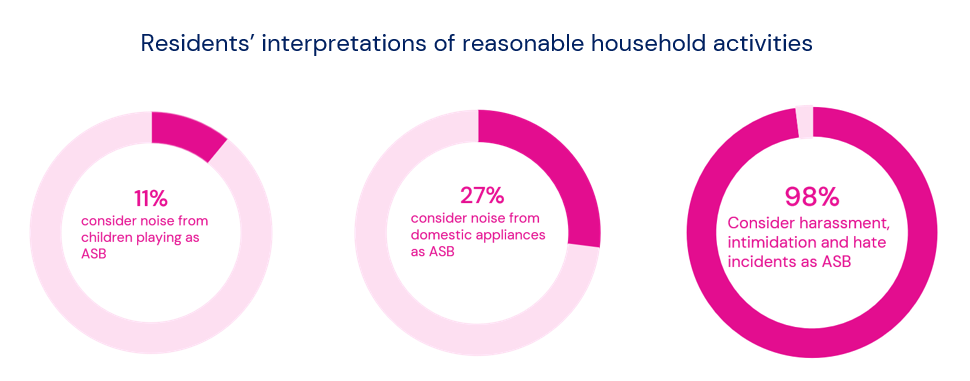
The Government’s Social Housing Resident Panel demonstrates how differently residents can interpret that boundary. Among participants, only 11% considered noise from children playing to be ASB and 27% identified excessive noise from domestic appliances. This compared with 98% for harassment, intimidation and hate incidents. Participants repeatedly emphasised the importance of context, with one resident describing the issue as: “One person’s ASB is another’s summer party.” The panel was qualitative and not representative of all social housing residents, but it provides useful evidence about the range of expectations landlords need to manage.
Tolerance is not a fixed threshold. Working patterns, property design, sound insulation, household composition and previous experience can all affect how behaviour is perceived. Someone working nights may experience daytime household noise differently from someone working traditional hours. A resident living in a poorly insulated flat may hear ordinary activity much more clearly. A person who has previously experienced intimidation may interpret a new disturbance within that wider context.
These differences do not necessarily mean that society has become less tolerant, or that one generation is more likely than another to report ASB. There is not enough verified evidence to support that conclusion. However, residents’ expectations of landlords have become clearer, and improved digital access has created more immediate routes through which concerns can be raised. Increased reporting may therefore reflect greater visibility and accessibility as much as a change in the behaviour itself.
Landlords must avoid two opposite errors. Over-recording everyday living noise as ASB can stigmatise normal behaviour, increase neighbourhood tensions and consume limited specialist capacity. Under-recording repeated or escalating incidents as neighbour disputes can mask serious harm and leave residents unsupported.
Good triage should establish whether an incident is isolated or repeated, identify its effect on the resident, assess vulnerability and safeguarding concerns, and recognise where a pattern is developing. A clear audit trail is essential, particularly where an initial noise or tenancy-management report later crosses the threshold into ASB.
Why summer matters…
Our analysis of ASB figures and Met Office temperature data provides strong evidence of a seasonal relationship. Monthly case volumes have a strong correlation with mean temperature (0.61). The R2 figure from our analysis found that changing temperature explains over a third (37%) of the movement in monthly case volumes – showing it to be an important influence.
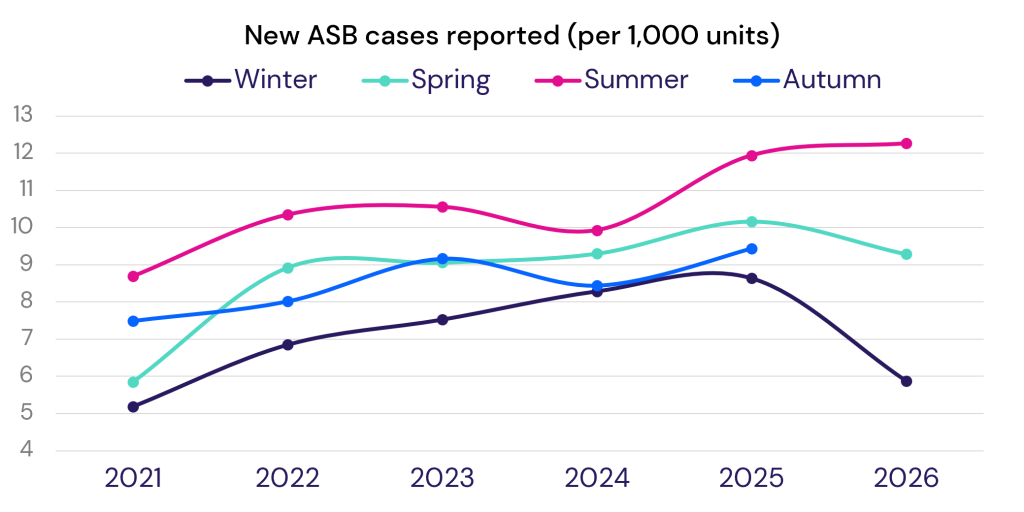
Across the full trend, our data shows that ASB case volumes are typically around 50% higher during summer than winter. Warm weather brings people into gardens, streets, communal areas and public spaces, while windows remain open later into the evening.
Climate change could gradually alter this established pattern. Our supporting analysis found that mean temperatures increased by 10% between 2015 and 2025, with spring mean temperatures increasing by 24.4%. Pulse caseloads in spring 2026 were 59% higher than in spring 2021. While these figures do not prove that warmer springs increase ASB, they raise an important point. If warmer conditions begin earlier and continue later, the traditional ASB summer peak may broaden into a longer period of elevated demand, requiring landlords to consider staffing levels and structures.
This risk is consistent with the wider climate outlook. The Met Office reports that the UK has warmed by approximately 0.25°C per decade since the 1980s and expects heatwaves to become more frequent and intense. Climate adaptation is therefore not solely an assets, building-safety or resident-welfare issue. It may increasingly become a neighbourhood-management and workforce-planning consideration too.
Landlords should begin to consider whether historic assumptions about seasonal demand remain appropriate. A summer plan built around July and August may no longer be sufficient if higher case volumes begin in spring and continue into early autumn.
Summer of heatwaves and major events
The 2026 Men’s World Cup coincided with the sharpest part of this summer’s increase in ASB. Our monthly data from landlords cannot establish whether individual cases were connected to matches, as warmer weather in general, school holidays, local events, and reporting practices also influence case volumes.
However, evidence from police and criminal justice bodies shows that major football tournaments can act as an aggravating context for existing abuse, disorder and hate incidents.
Before the tournament, the Crown Prosecution Service highlighted research showing that domestic abuse incidents have historically increased by 26% when England plays and by 38% following a defeat. Crucially, football does not cause domestic abuse. Increased alcohol consumption and heightened emotions can exacerbate existing abusive behaviour and increase the risk faced by victims.
Post-tournament policing figures underline the seriousness of that risk. Police recorded 384 domestic abuse incidents associated with the 2026 World Cup, representing 17% of 2,322 football-related incidents. Of those domestic abuse reports, 93% occurred around England matches. Police also assessed 293 online reports as meeting the threshold for hate crime. The national football policing lead said that alcohol was considered a contributing factor in most reported incidents and raised concerns that late changes to licensing hours restricted the opportunity to adjust officer rostering.
Domestic abuse must not be treated simply as a subset of ASB. It is a serious criminal and safeguarding issue requiring distinct risk assessment, referral and support arrangements. Nevertheless, the World Cup evidence illustrates a wider planning point for landlords. Major events may affect demand inside homes, licensed premises, neighbourhood spaces, and online at the same time.
Summer readiness should therefore extend beyond preparations for noise nuisance and outdoor gatherings. It should include clear domestic abuse and safeguarding routes, hate incident procedures, emergency escalation arrangements and established relationships with police and specialist local services.
Are we seeing more ASB or better recording?
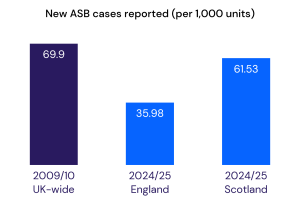
Recorded ASB volumes remain substantially below the levels our data showed 10 to 15 years ago. Pulse participants reported 38.86 cases per 1,000 homes over the 12 months to July 2026, compared with around 70 cases per 1,000 homes in the early 2010s.
However, the recent direction is upwards. Around three cases per 1,000 homes were recorded each month between April and July 2021, compared with an average of 3.5 between April and July 2026. Among a consistent dataset of 29 landlords, July’s case rate increased by 39.6% between 2021 and 2026.
Wider evidence points to continuing prevalence, while also demonstrating the difficulty of making long-term comparisons. The Crime Survey for England and Wales found that 40.9% of adults experienced or witnessed ASB in the year ending March 2026, up from 35.5% a year earlier. The ONS cautions that some of the increase was genuine, but that the scale of the movement was also inflated by changes to the survey questions introduced from April 2025.
Police-recorded incidents tell a different story. Government analysis shows that police-recorded ASB fell by approximately half between 2013/14 and the year ending December 2025, from around 2.1 million to one million incidents. The Government has also acknowledged that there is no comprehensive national dataset covering ASB reports made to local authorities, social landlords and other non-police agencies. New reporting requirements introduced through the Crime and Policing Act 2026 are intended to improve the picture across England and Wales.
Changes in definitions, systems, reporting routes and organisational responsibility can materially affect the result. Our master data contains landlords’ comments explaining movements caused by new working practices, historic cases being added, delayed logging, revised methodologies and the treatment of reports within other service categories. This exclusive insight provides greater context and helps landlords to understand the considerations and tactics required. It also shows substantial variation between organisations and across all four UK nations.
Incidents at some landlords that may previously have been recorded as ASB are now managed as tenancy issues, estate-management contacts, safeguarding concerns, domestic abuse, hate crime or neighbourhood disputes. However, other landlords’ clearer reporting routes and specialist triage have resulted in incidents being recognised as ASB that would previously have gone unrecorded. Lower case volumes do not automatically demonstrate safer neighbourhoods, just as higher volumes do not automatically indicate a failing service.
Capacity falling as demand becomes more complex
Summer demand often rises at the same time as operational capacity becomes less flexible. Annual leave affects housing teams, police, local authorities and partner organisations simultaneously. Case officers may be covering wider patches, while key contacts in safeguarding, environmental health or neighbourhood policing are also away.
The risk is not limited to a slower initial response. Reduced continuity can weaken information sharing, delay multi-agency decisions and leave residents repeating their story to several people. Complex cases can lose momentum when ownership changes, particularly where actions depend on several organisations.
Our annual benchmarking shows that the median number of housing-management FTEs fell to seven per 1,000 homes in 2024/25, 5% lower than in 2022/23. The movement towards specialist roles has continued, but from a comparatively small base. The proportion of landlords reporting dedicated ASB employees increased from 41% in 2022/23 to 53% in 2024/25. These figures show that an average landlord with 10,000 homes employed one ASB specialist FTE in 2024/25.
This creates a tension. Specialism can improve expertise, triage, legal decision-making and case discipline, but a small specialist team can become a bottleneck during annual leave or sudden spikes in demand.
Summer planning must therefore consider more than total headcount. Landlords need appropriate cover for named case officers, clear authority for urgent decisions, continuity arrangements for high-risk cases and reliable access to partner agencies.
Specialist teams improve visibility
Our data provides a strong case for specialisation, although not an unqualified one. Landlords employing ASB specialists reported 37% more cases on average and satisfaction with ASB handling that was 1.5 percentage points higher than among landlords without specialists.
The stronger relationship is between specialism and case volume rather than specialism and satisfaction. This suggests that specialist teams may improve recognition, categorisation and recording more readily than they transform residents’ perceptions.
Higher recording should not automatically be interpreted as poorer neighbourhoods or weaker performance. It may indicate more accessible reporting routes, clearer definitions, earlier identification and employees who understand when a nuisance report has crossed the ASB threshold.
A similar finding is evident in policing. HMICFRS found that better-performing forces used central ASB expertise, data analysis and specialist advisers to support neighbourhood teams. Weaker responses were associated with poor-quality data, inadequate IT systems, limited analytical capacity and inconsistent training. Specialist advisers helped staff understand the available legal powers and select appropriate interventions.
The most effective model according to our unique data, analysis and insight is likely to combine specialist oversight with confident front-line triage. Every report should not require specialist involvement from the outset, but every employee receiving a report should recognise vulnerability, repetition, safeguarding indicators and the point at which escalation is necessary.
From seasonal response to year-round readiness
July’s figures should prompt action but not panic. A summer rise is expected, and more cases can reflect a service that is making it easier for residents to report concerns. The more revealing questions are whether landlords understand what sits behind the increase, whether repeat and higher-risk cases are identified early, and whether residents receive a consistent response when teams are under pressure.
Our 7 top tips for effective readiness:
| 1 | Identify likely seasonal hotspots using previous case, contact and neighbourhood data |
| 2 | Review annual-leave cover and decision-making authority for complex and high-risk cases |
| 3 | Ensure clear triage thresholds for everyday living noise, repeated nuisance, harassment, hate incidents, safeguarding and domestic abuse |
| 4 | Agree communication and escalation routes with police, local authorities and community partners |
| 5 | Provide realistic expectations and regular updates, including where formal enforcement is not appropriate |
| 6 | Identify repeat reporters, locations and subjects across systems rather than viewing incidents in isolation |
| 7 | Evaluate whether activity has reduced harm, rather than focusing solely on whether a case has been closed. |
The conclusion is that a higher case rate is neither inherently good nor bad. Very low volumes may indicate barriers to reporting, misclassification or a lack of confidence in the response. High volumes may reflect accessible services and good recording, but they could also indicate repeat demand, unresolved problems or thresholds that are too broad.
Performance can only be understood by considering volumes alongside case quality, response times, resident experience, repeat reporting, outcomes, workforce capacity and local context.
If you are looking to understand your ASB volumes, resources, satisfaction and service model in context, contact us about benchmarking, consultancy support and ASB Accreditation consultancy@housemark.co.uk.
Month in numbers: July 2026
The results in the table below have been calculated based on submissions from 132 social landlords.
Open an Excel version of this table
| Measure | Lower Quartile | Median | Upper Quartile | Change (Jun – Jul) |
| Repairs and maintenance | ||||
| Percentage of homes with a valid gas safety certificate | 99.71% | 99.96% | 100.00% | No change |
| Percentage of homes for which all required electrical safety checks have been carried out | 98.49% | 99.50% | 99.90% | – 0.1% |
| Responsive repairs completed (per 1,000 units)* | 245.6 | 283.2 | 322.1 | + 1.4% |
| Percentage of non-emergency responsive repairs completed within target | 81.6% | 88.5% | 93.5% | – 0.3% |
| Responsive repairs outstanding (‘work in progress’) | 8.3% | 5.5% | 3.4% | – 3.3% |
| Satisfaction with repairs (transactional) | 82.2% | 89.0% | 93.4% | – 0.3% |
| Housing management | ||||
| ‘True’ current tenant arrears | 3.51% | 2.49% | 1.98% | – 3.1% |
| Percentage of dwellings vacant but available to let | 0.89% | 0.53% | 0.33% | – 8.5% |
| Average re-let time in days (standard re-lets) | 69.2 | 50.5 | 31.9 | 6.3% |
| New ASB cases reported (per 1,000 units)* | 2.42 | 4.58 | 8.40 | 24.3% |
| Customer experience | ||||
| Formal Stage 1 & 2 complaints received (per 1,000 units)* | 5.27 | 7.10 | 9.83 | + 7.5% |
| Percentage of Stage 1 & 2 complaints resolved within timescale | 92.7% | 97.9% | 100.0% | + 0.1% |
| Percentage of customer contact received via digital channels* | 24.7% | 39.9% | 52.0% | + 7.2% |
| Average time taken to answer inbound telephone calls (in seconds) | 336.0 | 144.0 | 76.0 | – 8.0% |
| Satisfaction with the service their landlord provides (perception) | 70.4% | 77.2% | 81.6% | + 3.5% |
| Staffing | ||||
| Percentage of working days lost to sickness absence | 4.8% | 3.5% | 2.9% | – 0.1% |
| Percentage of voluntary staff turnover | 1.2% | 0.8% | 0.5% | – 1.9% |
| Awaab’s Law | ||||
| New emergency hazards reported per 1,000 properties* | 20.4 | 45.8 | 74.2 | – 7.0% |
| New significant damp and mould hazards reported per 1,000 properties* | 0.6 | 2.8 | 7.6 | 25.4% |
| Percentage of emergency hazards resolved within 24 hours | 95.6% | 98.0% | 100.0% | No change |
| Percentage of significant damp and mould hazards investigated within 10 working days | 87.5% | 97.6% | 100.0% | – 1.3% |
| Percentage of significant damp and mould repairs initiated within 5 working days | 77.3% | 99.4% | 100.0% | + 0.8% |
The quartiles presented in this table are presented with polarity, which means that Upper Quartile always represents the most favourable quartile. Some KPIs don’t have a polarity (indicated with a * next to the measure name) – meaning that neither high or low values are better. In these instances, Upper Quartile represents the largest values and Lower Quartile, the lowest.