
As Andy Burnham begins his tenure as Prime Minister, we are beginning to understand, one policy at a time, how his approach differs from previous governments following several policy announcements. For the housing sector, however, the core agenda remains the same – how to build more homes against a backdrop of continuing economic headwinds.
Alongside other key issues such as homelessness and temporary accommodation, the return of Angela Rayner as Secretary of State for Housing, Communities and Local Government has been welcomed by the sector. The reinstated secretary was seen as one of the key architects of the increased prominence of the housing agenda.
Housemark’s exclusive work with the Housing Futures Network is helping inform the direction of housing and future housing need. Building on qualitative research involving almost 1,200 housing association professionals and residents, we have built a picture of how services are delivered today with a vision for where they could, and need, to go in the future.
Due out in September, revealed exclusively in Liverpool, this key piece of research will set the stage for wider debates at the Homes and Communities Summit and will influence thinking about the relationship between people living in social housing and organisations managing those homes.
At a glance
This month’s trends
Awaab’s Law
The Ministry of Housing, Communities and Local Government (MHCLG) has confirmed that Awaab’s Law Phase 2 will go live for English social landlords at the end of November. This substantially widens the scope of the regulations to include seven additional types of significant hazard.
Pulse data, currently the only sector-wide source of hazard performance reporting, is showing landlords’ systems beginning to bed-in for Awaab’s Law Phase 1. Despite a slow start, as providers grappled with interpretation and implementation, the median result for standard investigations of significant damp and mould hazards is now 100%. This means that more than half of landlords submitting data met this target every time in June 2026.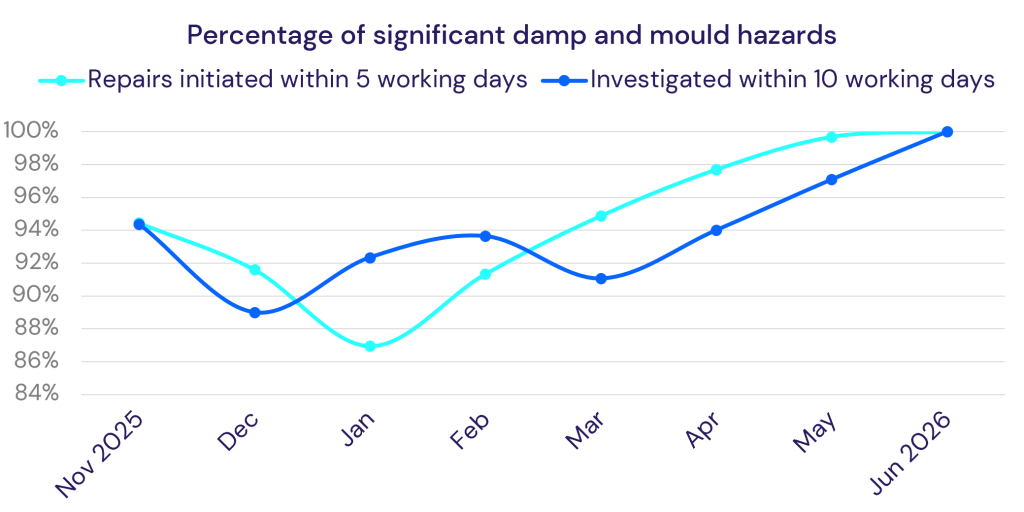
The volume of emergency hazards has moderated in recent months, following initial confusion among many landlords as the Phase 1 scope extended well beyond damp and mould. June’s median result of 45.2 hazards per 1,000 homes is less than 4% different to May, with all quartile positions inside the expected parameters of 20-100 based on emergency repairs volumes.
Our own exclusive research has revealed gaps in readiness for Phase 2, with a staggering two-thirds of landlords attending our Awaab’s Law webinar in June unclear about which hazards were included. Even with clearer guidance now available from MHCLG, Awaab’s Law moving out from repairs teams to housing management introduces new processes and hand-offs. These activities must be completed and recorded within the required timescales to meet regulatory targets. As a result, tenant-focused communication, effective processes and workflows, and the right organisational culture are becoming just as important as service delivery.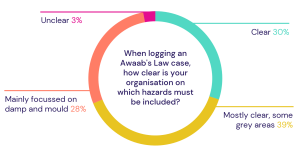 With four months to prepare for Phase 2 of Awaab’s Law, many landlords are looking to cement in processes that use data from CRMs, housing management, and assets, with an added time dimension to measure targets.
Anti-social behaviour
Housing-related ASB has a distinct seasonal pattern with noise nuisance forming the largest group of ASB incidents reported to social landlords. With people socialising outdoors and keeping windows open in hot weather, more complaints are made and recorded. This contrasts with the winter, when cold, dark nights mean fewer people socialise outside and windows are shut to keep the heat in.
Newly recorded ASB cases jumped 32% between May and June 2026. This rise at the median point usually occurs in July, coinciding with warmer weather and holidays. The size of the early increase in June has been driven by record-breaking hot weather and the start of the men’s football World Cup. Continued higher temperatures, combined with England’s performance in the knockout stages of the World Cup, mean we forecast continued elevated levels of ASB cases in July.
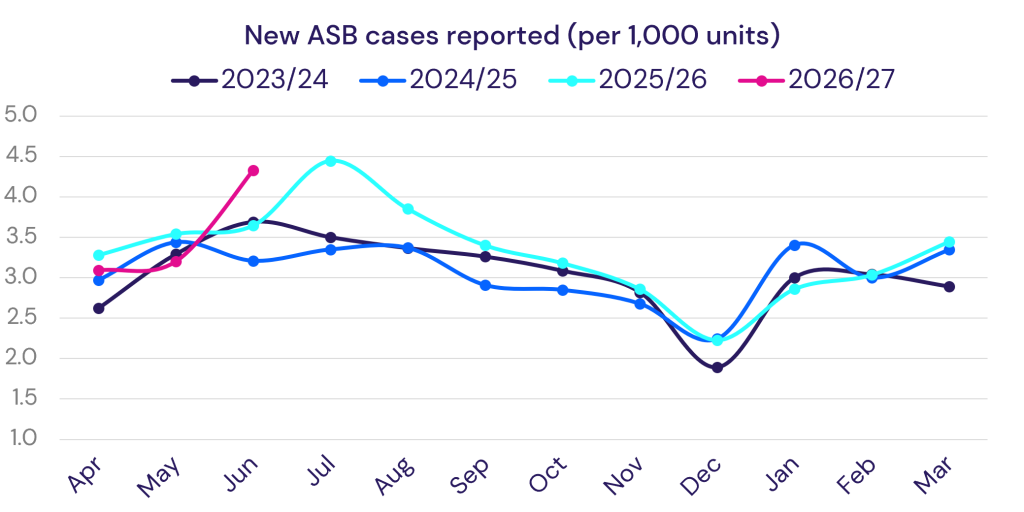
While weather and sporting events have some impact on the pattern of reported ASB, the availability and ability of staff to record ASB cases also features in its seasonality. Our trend data shows that June 2026 was the second highest monthly figure since April 2023. However, even if recorded ASB volumes continued at this pace for the rest of the year, they would still be lower than sector rates we recorded in the early 2010s (monthly averages of 5.8 cases per 1,000 homes).
The long-established pattern of ASB case seasonality appears to have arrived early in 2026. We will focus on this issue in more detail in the next issue of Pulse, due out late August.
Regulatory drivers
Our recent analysis of 2025/26 Tenant Satisfaction Measures (TSMs), collected by 223 English landlords, highlights the improvements to maintenance services being felt by tenants. With a set of ‘green lights’ across all responsive repairs TSMs, there is clear evidence that investment in current tenants’ homes is having a positive effect on overall perception.
Moreover, landlords achieving top C1 grades in consumer inspections are putting effort into regulated activities, which improve the landlord-tenant relationship and boost overall perceptions. However, while English landlords focus on consumer regulation, other operational activities are struggling to improve. The relationship between performance and regulatory focus is starting to emerge through data trends.
June’s Pulse data shows that in the first quarter of 2026/27, average re-let times have remained above six weeks. We have been tracking this measure monthly since 2023 and, compared to pre-pandemic rates, it has remained elevated, with medians typically between 40 and 50 days. Managing empty homes is not explicitly covered in RSH’s consumer regulations, and there are no TSMs looking at this business-critical activity.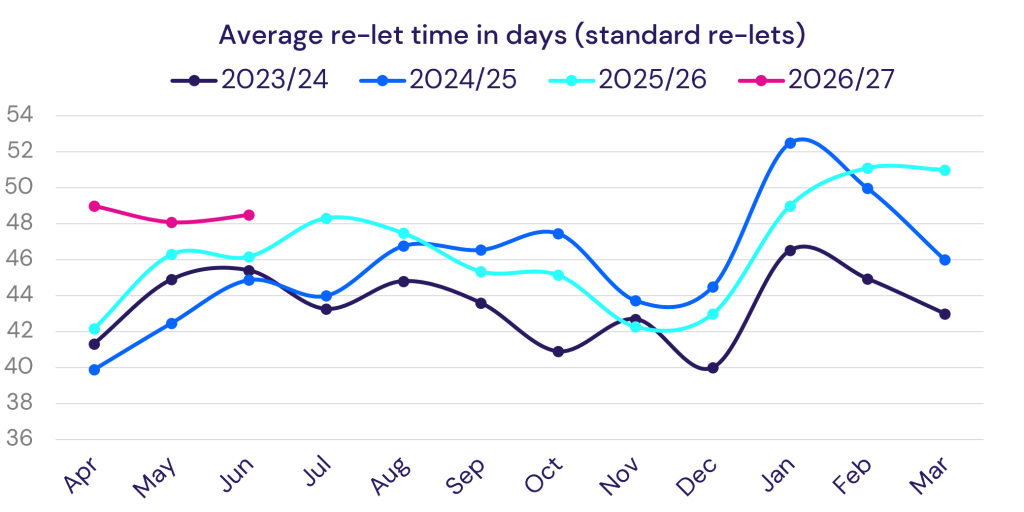
With improvements in landlord performance often closely linked to regulatory drivers such as consumer standards and TSMs, one explanation for chronically long re-let times that came from our 2024 voids research relates to a lack of senior-level oversight and understanding of the issue while attention is diverted to regulated activities.
While Low-Cost Home Ownership (LCHO) has a presence in TSMs (for landlords owning more than 1,000 units), our analysis has found a widening gap between shared owners’ and tenants’ perceptions of their landlord’s service.
Less than half (48.3%) of shared owners surveyed in 2025/26 were satisfied with the overall service provided by their landlord, compared to 74.2% for tenants. Although satisfaction for this group has always been lower, this gap has widened by almost five percentage points since 2024/25.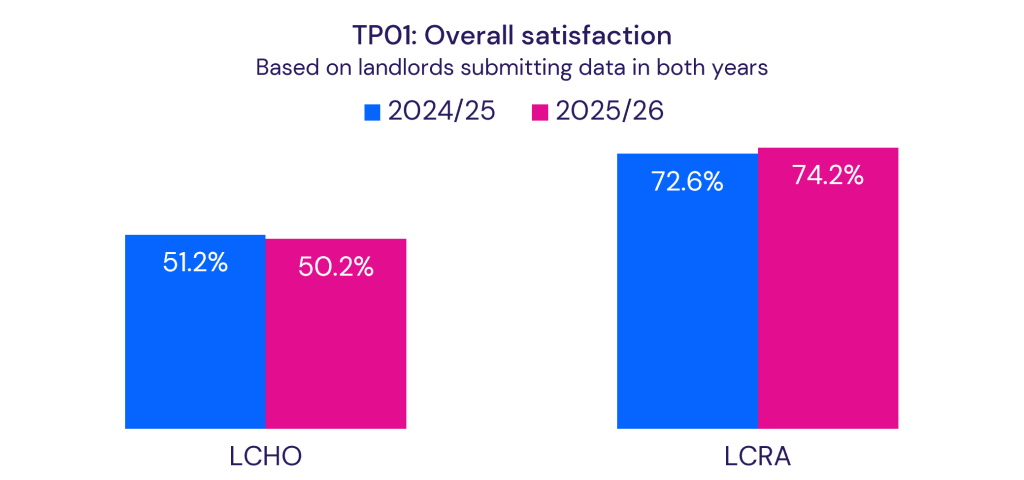
Being responsible for repairs in their homes, shared owners are not reaping the same benefits of improved maintenance services as tenants. So, communication is the strongest driver of satisfaction. The widening gap suggests that landlords are not managing to meet service expectations or improve communications.
Services to people living in LCHO accommodation are not specifically mentioned in RSH consumer inspection reports. Even though the customer experience is necessarily different for this group, consumer standards do not focus specifically on LCHO or shared ownership as distinct from rented tenures. With sector stakeholders launching a new shared ownership code, we anticipate increased focus to shift towards this tenure and work to improve perceptions.
Drive Service Excellence. Stay Ahead of Regulation.

Awaab's Law Assessment
Ensure compliance with new legal duties. Drawing on the expertise of John Wickenden and his engagement with MHCLG, we provide a comprehensive review of policies, processes, data and case management, and practical recommendations to strengthen compliance, safety and service delivery.

ASB Accreditation
Managing anti-social behaviour is becoming increasingly complex and while the TSMs help highlight performance, these stats will only ever tell part of the story. Demonstrate you’re delivering excellence with a complete 360-review of how you prevent and respond to ASB cases within your organisation.

LCHO TSM Analysis
Make sense of survey data with our TSM analysis. Taking feedback directly from the data you have captured, we’ll provide independent analysis of key trends, reveal areas for improvement, and provide a roadmap of recommendations that will help improve your performance.
In Focus
Complaints: From compliance to culture
Few areas of housing management have changed as dramatically over the last three years as complaints. Housemark has shared monthly complaints insights through Pulse since 2021 and collected stage 1 and 2 complaints volumes since April 2023. Since then, complaint volumes have almost doubled. What was once viewed as a regulatory requirement is increasingly becoming a key measure of organisational culture, service quality and resident trust.
The introduction of the Housing Ombudsman’s mandatory Complaint Handling Code in April 2024 marked a significant turning point. The code established clear expectations around accessibility, timescales, escalation, and learning, creating a more consistent framework for handling complaints across the sector. What has followed is a substantial increase in volumes, significant investment in specialist teams, and major improvements in compliance with complaint handling timescales. Yet the picture is far from straightforward.
While landlords are demonstrably handling complaints more quickly and investing more heavily in complaints services than ever before, resident satisfaction with complaint handling remains low. In many organisations, there is still a significant gap between what landlords record as a complaint and what residents believe they have complained about.
More complaints, but not necessarily a problem
The headline trend is impossible to ignore. Complaints volumes across the UK have increased by 90% since April 2023. The largest step-change came during the first year of implementation of the Complaint Handling Code, with volumes rising by 40% between April 2023 and April 2024, continuing to grow as the Code became embedded across the sector.
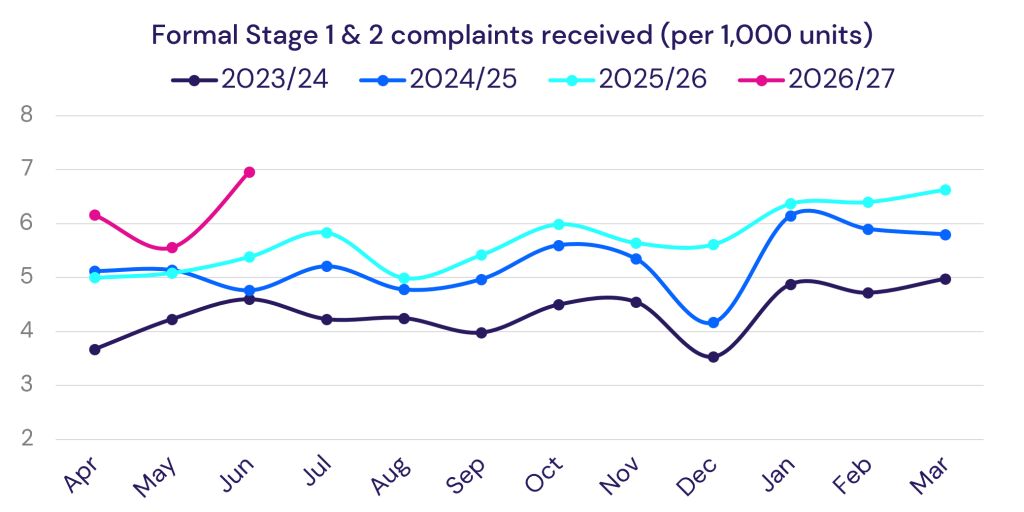
At first glance, rising complaints might appear to indicate deteriorating services. However, that interpretation is too simplistic.
The Complaint Handling Code was designed to make complaints easier to raise and harder to dismiss. It established clearer definitions, strengthened governance requirements, and reinforced the expectation that expressions of dissatisfaction should be formally recognised and recorded where appropriate.
Viewed through that lens, rising complaint volumes indicate improved accessibility and greater confidence in the complaints process. The Housing Ombudsman has noted, in a soon-to-be-published podcast, that residents appear more willing to raise concerns and landlords appear more willing to record them.
The trend is also consistent with what has happened elsewhere in public services when complaint frameworks have been strengthened. Better visibility often leads to more complaints in the short term, even when underlying service performance remains stable.
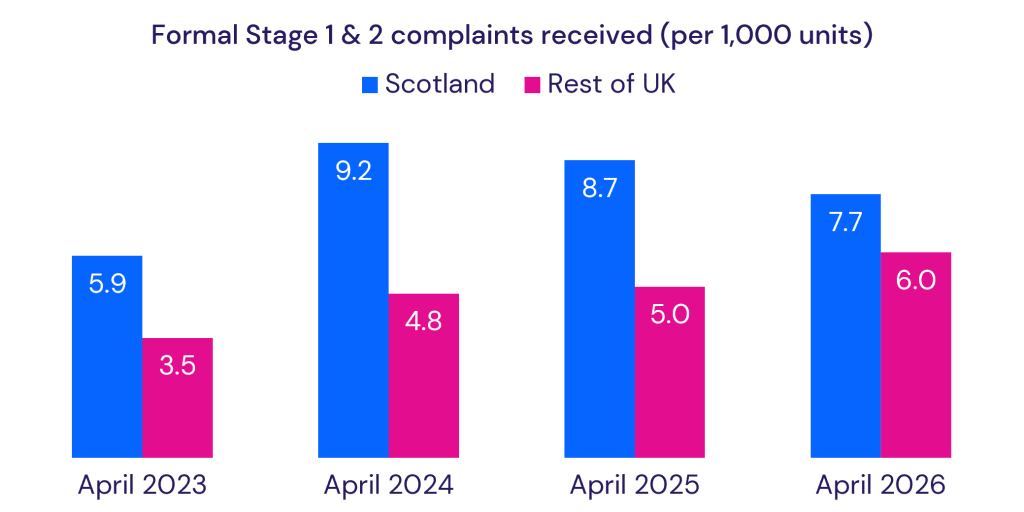
Our data also shows that complaint volumes in England and Wales are increasingly converging with those seen in Scotland, where landlords have historically recorded higher complaint rates. The gap has narrowed significantly in recent years, suggesting that recording practices and resident expectations across the UK are becoming more aligned.
Escalation is growing even faster
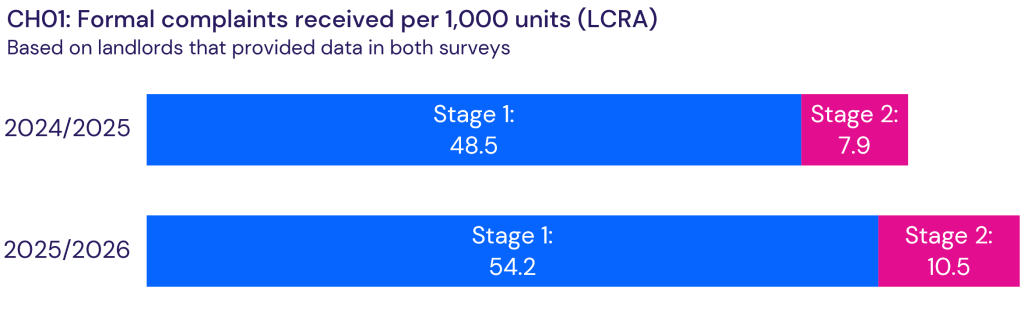
While overall complaint volumes have increased substantially, the most notable movement is occurring at Stage 2. Housemark’s early 2025/26 findings showed Stage 1 complaints increased by 11.6% since 2024/25, while Stage 2 complaints increased by 32.9%. This means escalation rates are increasing.
In 2024/25, landlords reported roughly one Stage 2 complaint for every six Stage 1 complaints. By 2025/26, that had increased to almost one Stage 2 complaint for every four Stage 1 complaints.
Our insights, exclusive data and analytical expertise reveal the following:
- Residents are becoming more aware of their rights under the Code and are more willing to challenge outcomes they consider unsatisfactory.
- Landlords are becoming more rigorous in recording escalations rather than resolving them outside the formal complaints process.
- While landlords are responding faster, residents are not always satisfied with the quality of those responses.
The growth in Stage 2 volumes suggests that timeliness alone is not enough. Residents appear increasingly willing to pursue complaints when they feel the underlying issue has not been resolved.
The sector has transformed complaint handling performance
If complaint volumes tell one story, performance against complaint handling timescales tells another. Before the Code came into force, the median landlord resolved around 84% of complaints within target timescales. Today that figure is regularly between 97% and 98%.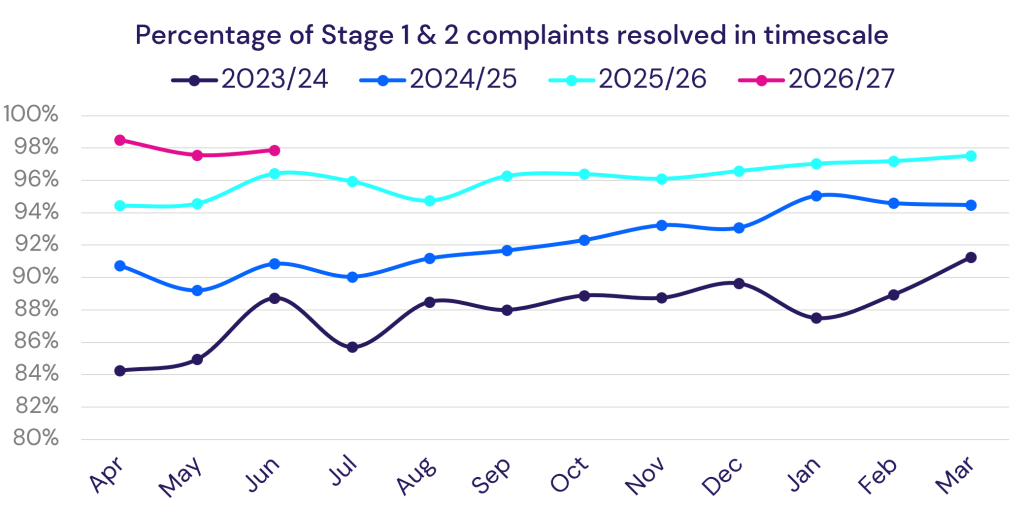
The proportion of landlords achieving more than 95% compliance has also increased dramatically. In April 2023, only 28% of organisations achieved this level of performance. In June 2026, that figure has risen to 64%.
The latest Monthly Pulse data shows formal complaints increasing by 25% month-on-month while median complaint handling performance still reached 97.9% resolved within target timescales.
This demonstrates that landlords have largely succeeded in adapting their operating models to handle substantially higher complaint volumes without sacrificing timeliness.
This indicates that activity undertaken by landlords to create more robust complaint handling processes has made a material difference to outcomes. Case management systems, specialist teams, monitoring arrangements, and governance structures have all matured considerably over a relatively short period.
The compliance challenge has been substantively addressed, leaving the fundamental question of whether that operational improvement is translating into better resident experiences.
Investment is rising rapidly
One reason complaint handling performance has improved so significantly is that landlords have invested heavily in the resources needed to deliver it. Specialist complaints and contact centre staffing increased by 144% in the two years to 2024/25. By this point, the average landlord with 10,000 homes employed around 20 specialist complaints and contact centre staff.
The cost of these services has risen just as sharply. In 2024/25, specialist complaints and contact centre functions cost an average of £71 per property, representing a 124% increase compared with 2022/23. These are among the fastest-growing staffing and cost categories in our benchmarking datasets.
Taken together, the figures suggest that complaint handling is no longer an admin support function. It is becoming a substantial operational activity requiring dedicated expertise, specialist systems, and significant ongoing investment.
So, why isn’t satisfaction improving faster?
Given the improvements in timeliness and investment, it would be reasonable to expect satisfaction with complaint handling to be increasing rapidly. However, that is not what the data shows.
Satisfaction with complaint handling increased by 1.5 percentage points to a median of 37%, making it one of the lowest-improving tenant perception measures in 2025/26.
Wider engagement measures tell a similar story.
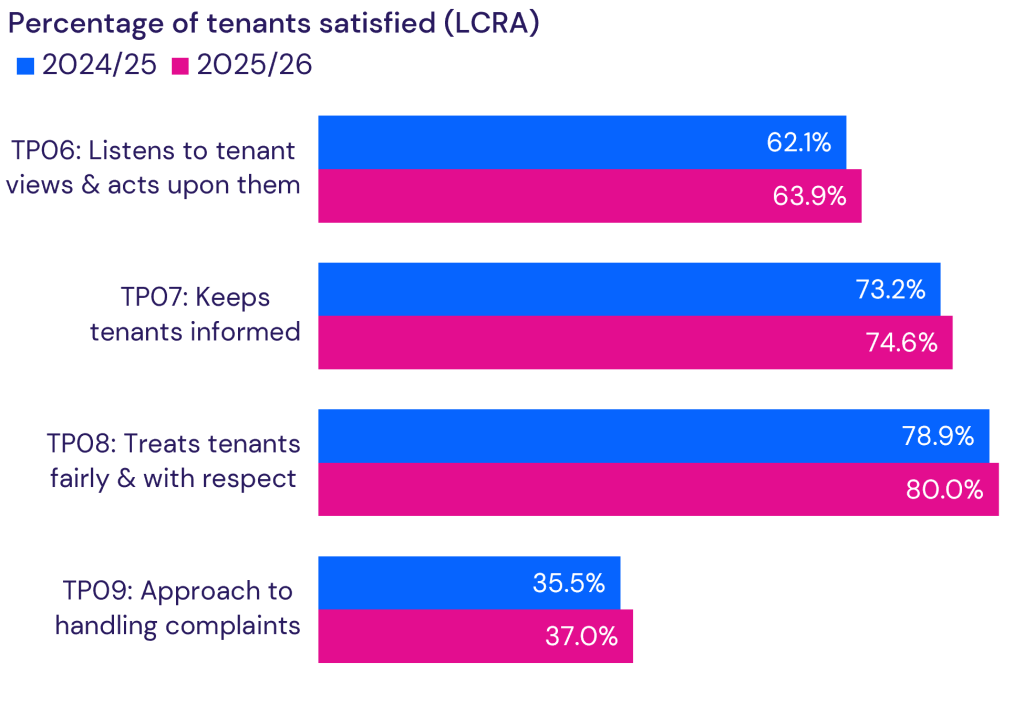
The findings suggest that residents judge complaint handling on more than just speed.
A complaint resolved within target timescales is not necessarily a complaint that feels resolved from the resident’s perspective. Residents care about being listened to, receiving meaningful explanations, seeing action taken, and believing that their experience will help prevent future problems. The data indicates that better processes alone are unlikely to deliver the next step-change in satisfaction.
Case study: Golding Homes
Golding Homes provides a useful example of how organisations can move beyond compliance and begin using complaints as a catalyst for service improvement.
The landlord manages over 8,500 homes and has reported a sustained improvement in complaint-handling satisfaction since the introduction of the statutory Complaint Handling Code. Satisfaction with complaints handling (TP09) increased from 32.4% in 2023/24 to 35.6% in 2024/25 and 40.3% in 2025/26, representing a 7.9 percentage-point improvement over two years.
The organisation’s operational performance improved significantly over the same period. Stage 1 responses delivered within Code timescales increased from 86.8% to 100%, while Stage 2 performance improved from 72.2% to 98.7%.
What makes the example particularly interesting is the focus on organisational learning.
Golding Homes centralised its Customer Resolution Team, helping reduce outstanding complaints by more than a third. It introduced action plans for agreed resolutions, assigned ownership for delivering those actions and embedded learning from complaints throughout management and service teams.
The landlord has also used Ombudsman spotlight reports and gap analyses to review its approach and identify opportunities for improvement.
Importantly, Golding does not present the improvement as a finished journey. Complaint-handling satisfaction remains at 40.3%, and the organisation acknowledges there is further work to do. That arguably makes the example more valuable. It demonstrates that meaningful improvements in satisfaction can be achieved when complaints are treated as a source of accountability, learning and service redesign rather than simply a compliance exercise.
Why learning remains the missing piece…
The sector has become much better at processing complaints. However, it is less clear whether landlords are as effective at learning from them. Despite the Complaint Handling Code’s requirement to self-assess, learning from complaints is often cited by the Housing Ombudsman as an improvement area in severe maladministration cases.
Exclusive insights from Housemark members found that only 3% of landlords report that they have mastered complaints insight. Nearly half describe themselves as developing their approach, while 38% remain at an emerging stage.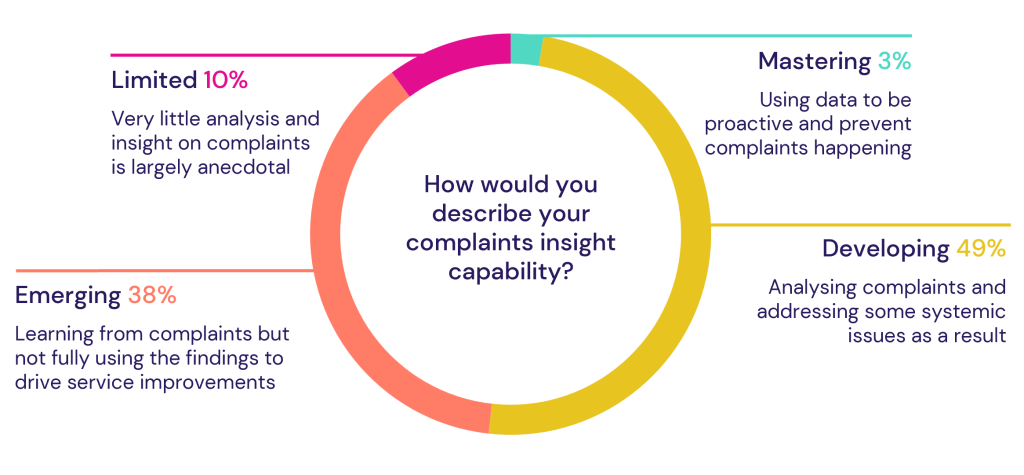
Lack of visible change following complaint resolution may help to explain why satisfaction improvements have lagged behind operational improvements.
Better-performing landlords are not simply responding to complaints more effectively. They are also capturing, understanding and using complaint information more consistently through robust processes focused on consumer standards. The next phase of improvement may therefore depend less on complaint handling and more on complaint insight.
The hidden complaints problem
The most common complaints issue we see discussed is the gap between complaints that residents believe they have made and complaints that landlords formally record.
Analysis of 2024/25 TSM returns shows that the median landlord reported 53.5 Stage 1 complaints per 1,000 homes. However, if every resident who reported making a formal complaint in the perception survey had done so, the equivalent figure would be 261 complaints per 1,000 homes.
That represents a difference of almost 500%. We have found a link between the degree of this difference and compliance with consumer standards.
Organisations achieving higher grades in consumer standards inspections have a smaller gap between the number of TSM respondents stating they have made a complaint and the number of Stage 1 complaints recorded. For top-rated C1 landlords, the average discrepancy is 4.7 times, compared with 5.8 times among lower-performing C3 and C4 graded organisations.
Some of the gap is driven by differences in interpretation. Residents may regard repeated service requests, expressions of dissatisfaction or informal contacts as complaints even when landlords classify them differently. However, the scale of the discrepancy suggests a broader issue, particularly when viewed in the round of wider consumer standards regulatory performance.
Many residents appear to believe they have complained when landlords do not. That matters because a complaint is one of the most valuable sources of service intelligence available to organisations. If complaints are not being recognised, recorded or analysed consistently, opportunities to identify recurring problems can easily be missed.
The Housing Ombudsman’s distinctions between service requests, expressions of dissatisfaction, and formal complaints have helped provide greater clarity. However, the data suggests that significant inconsistency remains.
From compliance to culture
The Complaint Handling Code has succeeded in driving greater consistency, visibility and accountability across the sector. Complaint volumes have risen, escalation rates have increased, and landlords have invested heavily in specialist teams and systems. At the same time, complaint handling performance has improved dramatically, with median compliance against timescales now approaching 98%.
Yet resident satisfaction has improved only modestly.
The challenge facing the sector is therefore no longer primarily about handling complaints quickly. It is about ensuring complaints lead to better outcomes, better communication and better services.
The most successful organisations are likely to be those that view complaints, not as evidence of failure, but as one of the richest sources of insight available. The data suggests that while the sector has made substantial progress on compliance, the next stage of improvement will depend on how effectively landlords can turn complaints into learning.
The trends explored here are drawn from our Monthly Pulse data, tracked and refreshed every month across the sector. If you want to see how your organisation’s complaint volumes, escalation rates, handling performance, and resident satisfaction compare against your peers, speak to us about accessing your own benchmarking data, get in touch.
How Housemark can help
Knowing your customers is more important than ever. Through our customer experience consultancy practice, we support organisations to understand, enhance and improve the end-to-end customer experience.
TSM Survey
Surpass compliance standards and leverage regulatory exercises to gain powerful insights, enhancing the lives of your residents and boosting your business
TSM Analysis
Maximise the effectiveness of TSM survey and priorities meaningful change to level-up your scores from the regulator whilst improving service to residence
CX Audit
Build Successful TSM strategies for the future and improve your reporting to the regulator with a deep understating of your survey performance
Month in numbers: June 2026
The results in the table below have been calculated based on submissions from 132 social landlords.
Open an Excel version of this table
| Measure | Lower Quartile | Median | Upper Quartile | Change (May – Jun) |
| Repairs and maintenance | ||||
| Percentage of homes with a valid gas safety certificate | 99.72% | 99.96% | 100.00% | No change |
| Percentage of homes for which all required electrical safety checks have been carried out | 98.29% | 99.46% | 99.86% | + 0.1% |
| Responsive repairs completed (per 1,000 units)* | 237.7 | 275.4 | 326.3 | + 5.9% |
| Percentage of non-emergency responsive repairs completed within target | 81.8% | 88.0% | 94.0% | + 0.6% |
| Responsive repairs outstanding (‘work in progress’) | 9.9% | 6.7% | 4.4% | + 6.1% |
| Satisfaction with repairs (transactional) | 85.2% | 90.5% | 93.6% | + 1.7% |
| Housing management | ||||
| ‘True’ current tenant arrears | 3.53% | 2.61% | 1.91% | + 1.4% |
| Percentage of dwellings vacant but available to let | 0.97% | 0.59% | 0.31% | + 6.3% |
| Average re-let time in days (standard re-lets) | 73.3 | 48.5 | 31.1 | + 6.4% |
| New ASB cases reported (per 1,000 units)* | 2.15 | 4.33 | 6.75 | + 31.8% |
| Customer experience | ||||
| Formal Stage 1 & 2 complaints received (per 1,000 units)* | 4.41 | 6.96 | 9.01 | + 25.0% |
| Percentage of Stage 1 & 2 complaints resolved within timescale | 90.7% | 97.9% | 100.0% | + 1.8% |
| Percentage of customer contact received via digital channels* | 23.0% | 35.9% | 51.1% | – 4.5% |
| Average time taken to answer inbound telephone calls (in seconds) | 338.0 | 137.0 | 70.0 | – 17.4% |
| Satisfaction with the service their landlord provides (perception) | 69.6% | 76.0% | 82.0% | – 1.4% |
| Staffing | ||||
| Percentage of working days lost to sickness absence | 4.7% | 3.6% | 2.8% | – 4.7% |
| Percentage of voluntary staff turnover | 1.4% | 0.8% | 0.5% | – 13.5% |
| Awaab’s Law | ||||
| New emergency hazards reported per 1,000 properties* | 25.4 | 45.2 | 72.3 | – 3.7% |
| New significant damp and mould hazards reported per 1,000 properties* | 0.8 | 3.1 | 8.9 | + 20.7% |
| Percentage of emergency hazards resolved within 24 hours | 92.2% | 97.5% | 99.8% | + 0.3% |
| Percentage of significant damp and mould hazards investigated within 10 working days | 88.3% | 100.0% | 100.0% | + 4.6% |
| Percentage of significant damp and mould repairs initiated within 5 working days | 81.5% | 100.0% | 100.0% | + 0.3% |
The quartiles presented in this table are presented with polarity, which means that Upper Quartile always represents the most favourable quartile. Some KPIs don’t have a polarity (indicated with a * next to the measure name) – meaning that neither high or low values are better. In these instances, Upper Quartile represents the largest values and Lower Quartile, the lowest.